Common Trading Patterns All Traders Should Know
Mar 04, 2022
There are a number of common trading patterns that all traders should be aware of. Four of the most popular patterns include: descending triangle patterns, head and shoulders patterns, cup and handle patterns, and ascending triangle patterns.
By understanding these patterns and how they form, traders can better see a possible outcome of where a stock may move to so that they can make profitable trades.
Descending Triangle Patterns
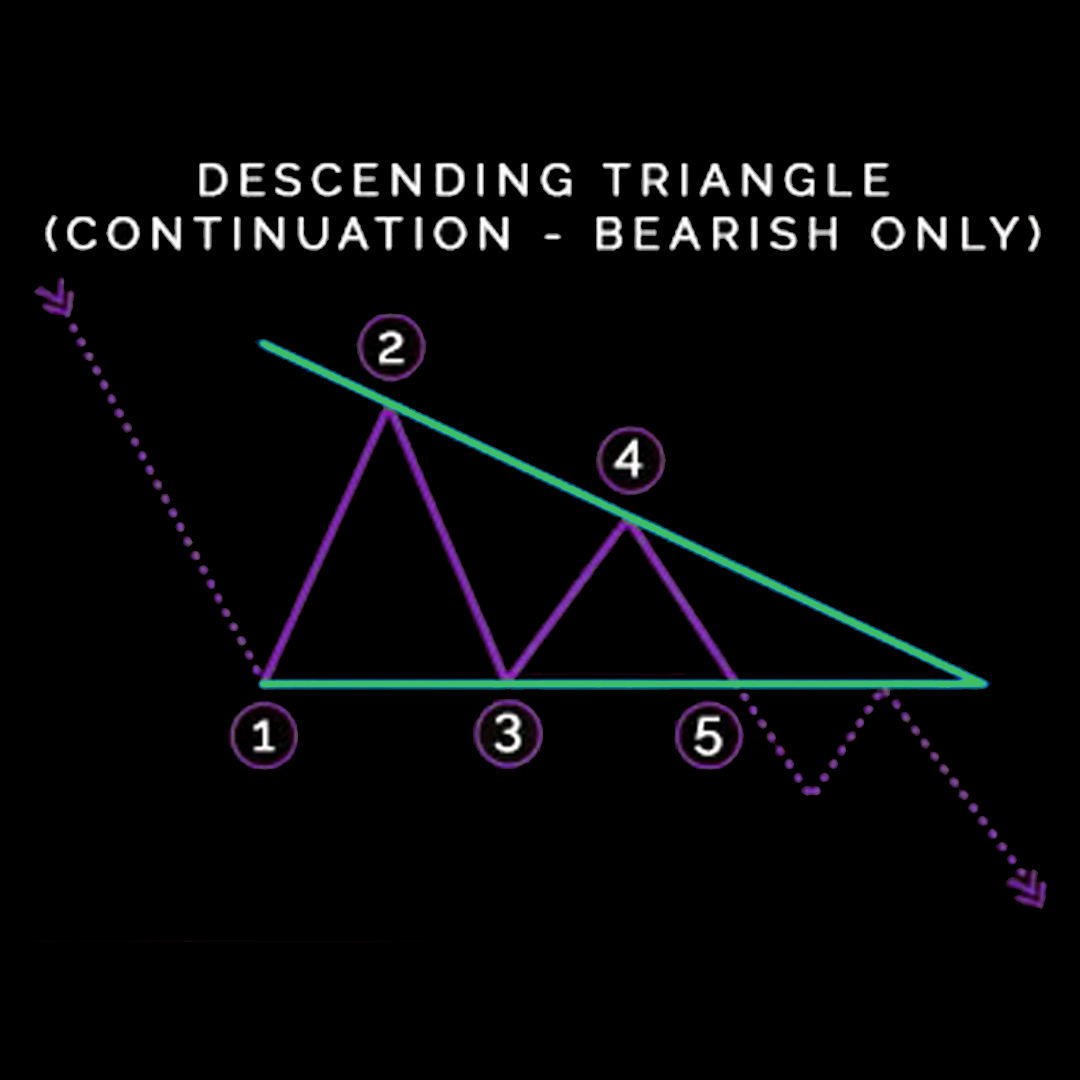
This pattern forms when a stock is in a downtrend and the price action creates lower highs and lower lows. This pattern typically forms before a breakout to the downside, so it is important to be aware of this pattern if you are trading stocks that are in a downtrend. A descending triangle is formed when there is a stock trading along side a descending trendline, while also adhering to a support line. Oftentimes, traders watch for a move below the lower support trend line because it suggests that the downward momentum is building and a breakdown is imminent. Once the breakdown occurs, traders enter into short positions and aggressively help push the price of the asset even lower. Descending triangles are a very popular chart pattern among traders because it clearly shows that the demand for an asset, derivative or commodity is weakening. Descending triangles can form as a reversal pattern to an uptrend, but they are generally seen as bearish continuation patterns. The limitation of triangles is the potential for a false breakdown. There are even situations where the trend lines will need to be redrawn as the price action breaks out in the opposite direction - no chart pattern is perfect. If a breakdown doesn't occur, the stock could rebound to re-test the upper trend line resistance before making another move lower to re-test lower trend line support levels. Often times the more times that the price touches the support and resistance levels, the more reliable the chart pattern.
Head And Shoulder Patterns

These patterns are reversal patterns that form after an uptrend. They are named for their shape, which resembles a head with two shoulders on either side. This pattern typically forms before a breakout to the downside, so it is important to be aware of this pattern if you are trading stocks that have been in an uptrend. The head and shoulders pattern forms when a stock's price rises to a peak and subsequently declines back to the base of the prior up-move. Then, the price rises above the former peak to form the "nose" and then again declines back to the original base. Finally, the stock price rises again, but to the level of the first, initial peak of the formation before declining back down to the base or neckline of chart patterns one more time.
Cup And Handle Patterns
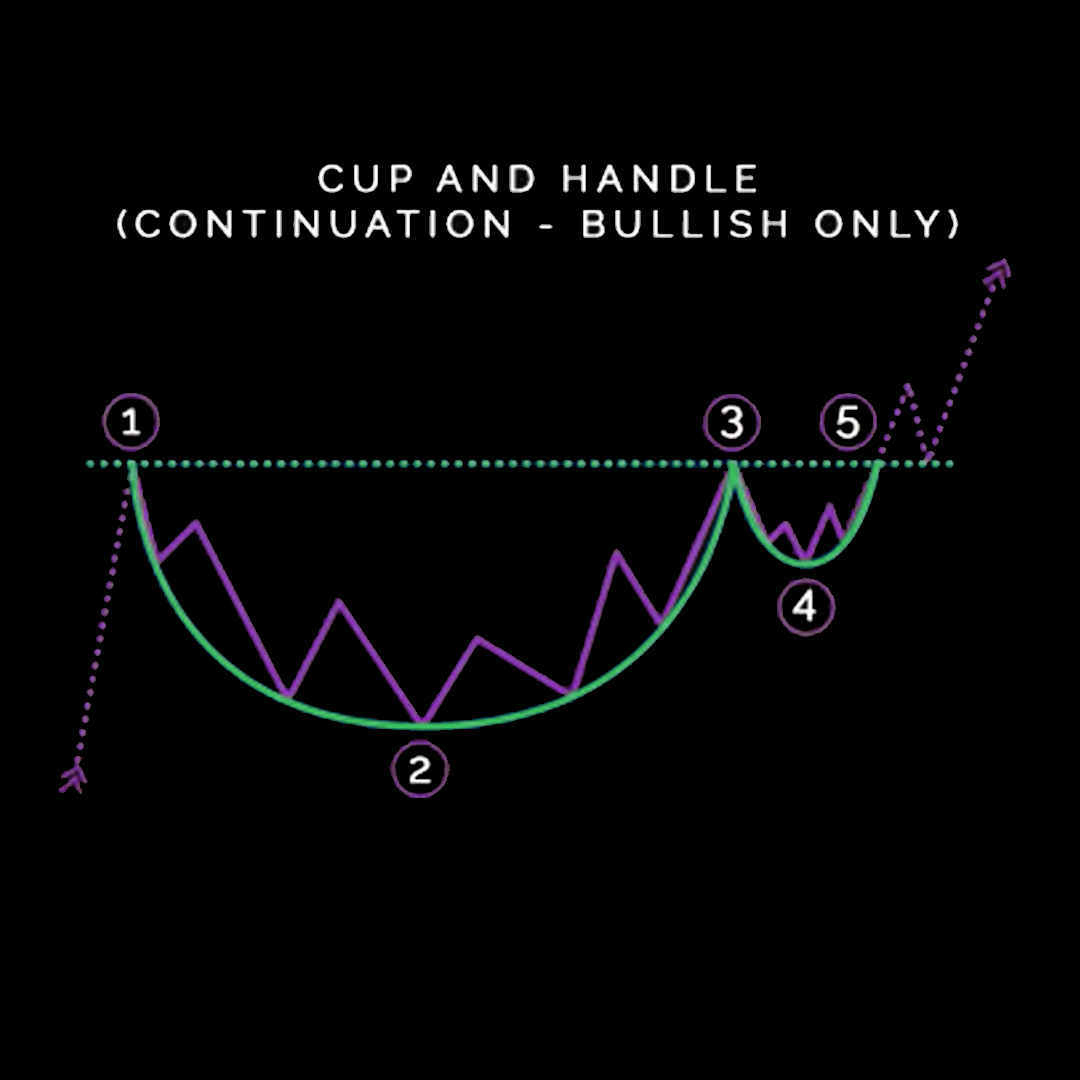
This pattern gets its name because it resembles a cup with a handle, The cup and handle is considered a bullish signal, with the right-hand side of the pattern typically experiencing lower trading volume. The pattern's formation may be as short as seven weeks or as long as 65 weeks. American technician William J. O'Neil defined the cup and handle (C&H) pattern in his 1988 classic, How to Make Money in Stocks, adding technical requirements through a series of articles published in Investor’s Business Daily, which he founded in 1984. O'Neil included time frame measurements for each component, as well as a detailed description of the rounded lows that give the pattern its unique teacup appearance. As a stock forming this pattern tests old highs, it is likely to incur selling pressure from investors who previously bought at those levels; selling pressure is likely to make price consolidate with a tendency toward a downtrend for a period of four days to four weeks, before advancing higher. Generally cups with a longer more "U" shape bottom provide a stronger signal. Also its ideal to avoid cups with a sharp "V" bottom. Ideally, the cup should not be overly deep. Avoid handles that are overly deep also, as handles should form in the top half of the cup pattern. Volume should decrease as prices decline and remain lower than average in the base of the bowl; it should then increase when the stock begins to make its move higher, back up to test the previous high.
Ascending Triangle Patterns
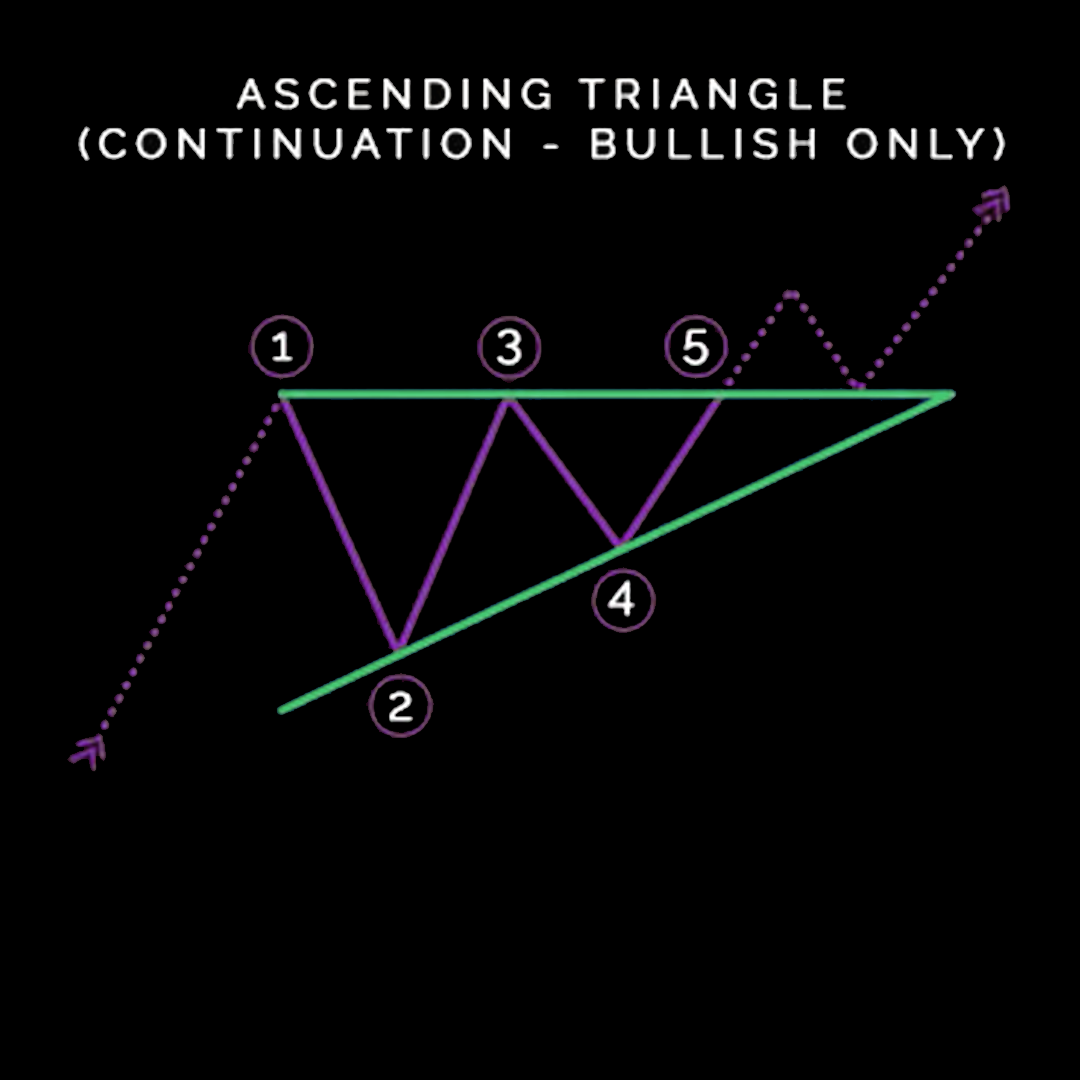
Ascending triangles are chart patterns that are created by price moves that allow for a horizontal line to be drawn along the swing highs and a rising trendline to be drawn along the swing lows. The two lines form a triangle. This pattern is opposite to the descending triangle mentioned earlier. Ascending triangles are bullish patterns that form in an uptrend and indicate continued buying pressure. These patterns often form in the middle or later stages of an uptrend and can last for days or weeks. Volume is another important factor when it comes to Ascending Triangle Patterns. As prices move higher, volume should increase on up days and decrease on down days, forming a narrowing price range before eventually breaking out to the upside. Once the breakout upwards occurs, traders enter into long positions and aggressively help push the price of the asset even higher.
As with all these patterns traders should not blindly enter into a position once the pattern is just forming but instead, wait for the confirmation of the breakout. The reason it is better to wait for the confirmation of the break out is simply because at the end of the day stocks do not have to adhere to these patterns and at any moment stocks can change course due to market events, so it is often recommended to wait for the breakout. A simple reminder that is mentioned often in the Push and Profit Private Group is that traders should not predict the market, but instead trade what the market presents.
The Profit Post's
Weekly Newsletter
Join our FREE weekly newsletter! Each week, we will bring you the latest news and insights on market trends, and key events that every market participant should be aware of. Our newsletter is perfect for individuals looking to stay informed and ahead of the game.
We hate SPAM. We will never sell your information, for any reason.
